


Clustering algorithms are used to analyze the data in an unsupervised fashion, in cases when the labels are not available, or to get the new insights about the dataset. The K-Means algorithm is one of the oldest clustering algorithms developed several decades ago but still applied in modern Machine Learning tasks. One of the ways to use this algorithm is to apply it for vector quantization — a process allowing to reduce the dimensionality of analyzed data. In this post, I’m going to implement a simple version of K-Means and apply it to Wrist-worn Accelerometer Dataset.
TL;DR: Please refer to the code using this this link to navigate right into the repository with vectors quantization implementation.
Post contents
K-Means Algorithm
The K-means clustering is a simple and elegant approach for partitioning a dataset into K distinct, non-overlapping clusters. The algorithm implementation can be easily formulated as the following pseudo-code shows.
- Assign random labels from range $1...K$ to each observation in dataset to get an initial partitioning.
- For each of $K$ clusters, compute the cluster centroid which is the vector of p feature means for the observations in the kth cluster. (In other words, each cluster's centroid is an average of vectors assigned to the cluster).
- Assign each observation to the cluster whose centroid is closest in terms of Euclidian distance metric.
- If clusters assignment was changed, go to step 2
- Return calculated cluster centroids and assigned labels.
Note that the algorithm uses the Euclidean metric to measure the similarity between data points. It means that each dimension is considered to be equally important to distinguish one sample from the another. Therefore, it is crucial to normalize your dataset before running the algorithm.
Figure 1 shows an animated process of K-Means clustering of a randomly generated dataset, where each cluster is rendered with a different color. While the algorithm iterates through its loop, the centroids slowly change their positions until there are no re-assignments anymore.
 Fig 1. K-Means clustering of dummy dataset with K=5
Because of the random generation of the initial centroids, it is a good idea to run the algorithm several times and choose the best clusters assignment. Which assignment is the best? For this purpose, one could use an inertia metric that is defined as a total distance from the samples to their clusters’ centroids as the equation below shows:
$$ I = \sum_{j = 1}^{K}{ \sum_{\substack{i = 1 \ x_i \in C_j}}^{N}{ d(x_i, c_j)} } $$
Where $K$ is a number of clusters, $N$ is a number of observations, $C_j$ is a set of observations belonging to the cluster $j$, and $c_j$ — the centroid of the $j$th cluster. This measure of clustering quality shows how close the dataset observations are to the centers of their clusters.
In next section, we’re going to implement K-Means clustering using the numpy library.
Implementation with NumPy
The full source code with K-Means clustering implementation is located there. In this section let’s highlight the key points of the algorithm.
To implement the main loop of K-Means clustering, we need a function that accepts a dataset, a number of clusters $K$, and a couple of additional parameters to specify how many restarts of the algorithm do we want to perform to find the best clustering assignment.
The dataset normalization requires us to subtract the mean of dataset values
from every sample and divide it by a standard deviation. To generate random
centroids, we can use one of the random generators from numpy.random module.
Calculating an inertia metric is also quite simple using numpy and its
filtering and linear algebra functions.
Before proceeding to the quantization algorithm, here is an important remark. Despite
of the fact that the implementation of K-Means algorithm provided in this post’s
repository is totally functional and does its job, it is quite far away from the
production-ready code. Check this link
from the scikit-learn library showing handling various edge cases and making the code
much faster than this naïve implementation, including fragments
written in Cython to achieve the higher performance.
Vectors Quantization
Before being used in the data mining for cluster analysis, the algorithm was originally used in the field of signal processing as a method of vectors quantization (VQ). The VQ is a data reduction method that means it seeks to reduce the number of dimensions in the input data so that the models used to match the unknowns can be as simple as possible.
Quantization allows transforming continuous values into the discrete buckets. Figure 2 shows a 2D plane filled with blue dots representing the values of random continuous real vectors. To discretize this space into a finite number of buckets, we can plot a grid on top of the plane with the blue dots and replace every blue dot with a red one which is the center of a grid cell where the blue dot falls.
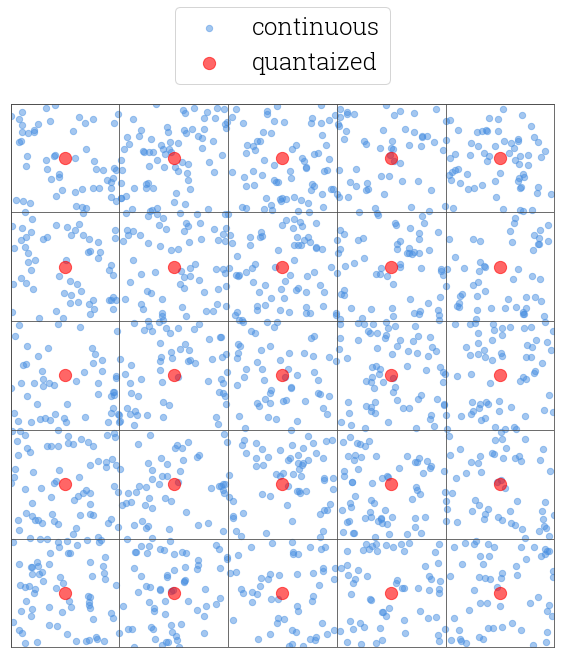 Fig 2. Continuous 2D points discretized into buckets
The K-Means algorithm allows us to do exactly this. Each centroid vector could be treated as a center of a “grid cell”, and can be used as a “discretized” representation of the vectors in proximity. But in the case of K-Means, the quantized vectors could have much more dimensions and the “cells” are not in 2D, but are generally in the $N$-dimensional space.
Next section shows how this idea can be used to convert observation vectors of an arbitrary length into a fixed-size feature vectors.
Applying K-Means to Accelerometer Data
Consider the following use case. You have a dataset with accelerometer measurements. Each measurement is saved into a separate text file and is represented by a sequence of $(x, y, z)$ coordinates. Also, each measurement belongs to one of $M$ activity types, like $PourWater$ or $Walk$. To convert this dataset into something suitable for a machine learning algorithm (SVM, decision tree, logistic regression or anything else), one needs to read measurements from files and concatenate their coordinates into feature vectors.
But what if each file contains an arbitrary number of coordinates, i.e. its length is not predefined? That is exactly the case of the Wrist-worn Accelerometer Data Set mentioned at the beginning of this post as the Figure 3 shows.
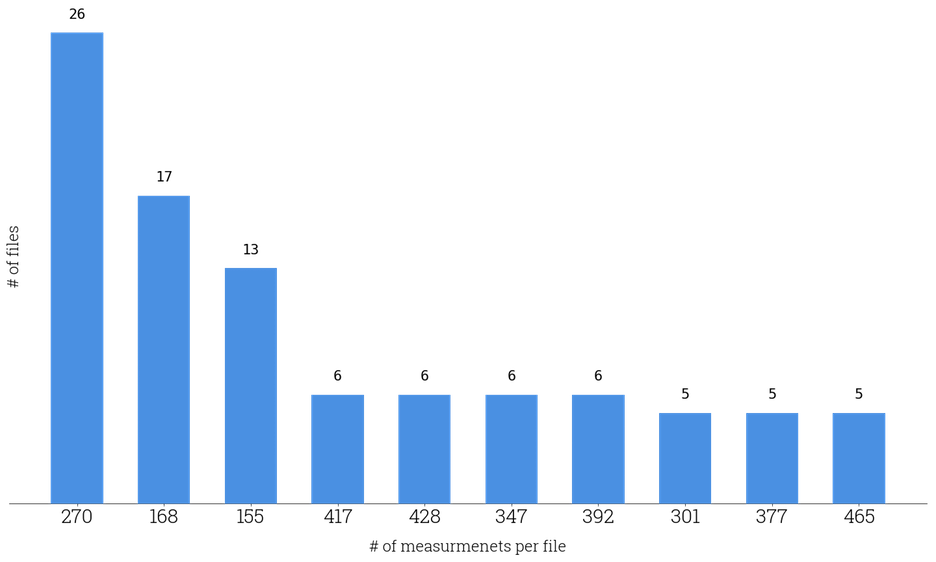 Fig 3. Histogram of most common file lengths
It is not possible to concatenate the measurements together because then each feature vector would have a different length. But K-Means clustering can help us to overcome this issue and prepare the dataset for classification. The process of mapping from an arbitrary length accelerometer observations array into a fixed-size feature vector is schematically shown in the Figure 4.
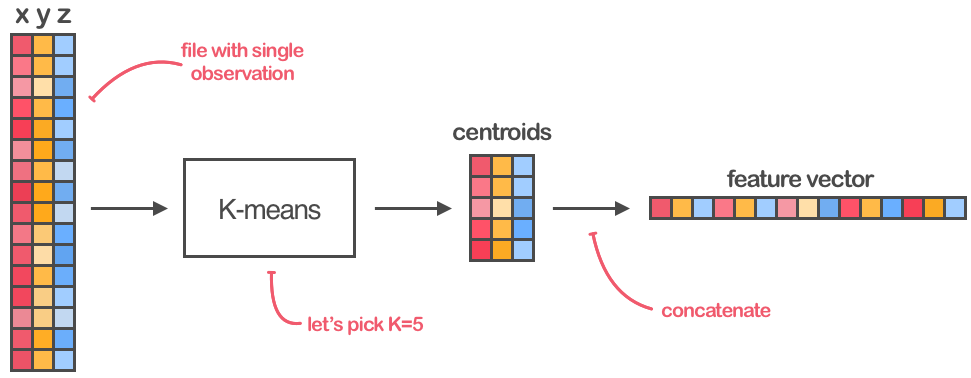 Fig 4. Using K-Means to create fixed-size feature vectors
Every of $N$ dataset’s files should be parsed into a matrix of accelerometer measurements with shape $(M_i, 3)$ where $M_i$ is the $i$th file length. Then, the clustering algorithm with $K$ clusters should be applied to every of these matrices, separately. Finally, the centroids calculated for every matrix should be concatenated into 1-dimensional feature vectors with length $K \times 3$, and then stacked together into the final matrix of size $(N, K \times 3)$.
The following snippet shows how this processes looks in the code.
The project with full implementation of the functions described in this post could be found via this link alongside with the aforementioned dataset and a couple of helper utilities.
Conclusion
The K-Means algorithm is a simple but powerful clustering technique that should have its place in every machine learning engineer’s toolkit. It could be applied not only in an unsupervised learning setting to discover the patterns of an analyzed dataset but also to reduce the dimensionality of the considered problem.
Though it is simple to implement this method from scratch, it is better to use a robust, scalable and well-tested solution instead, like this scikit-learn implementation that takes into account various edge cases and improvements.